FOCUS ON FEEDING DURATION DRIVES PERFORMANCE
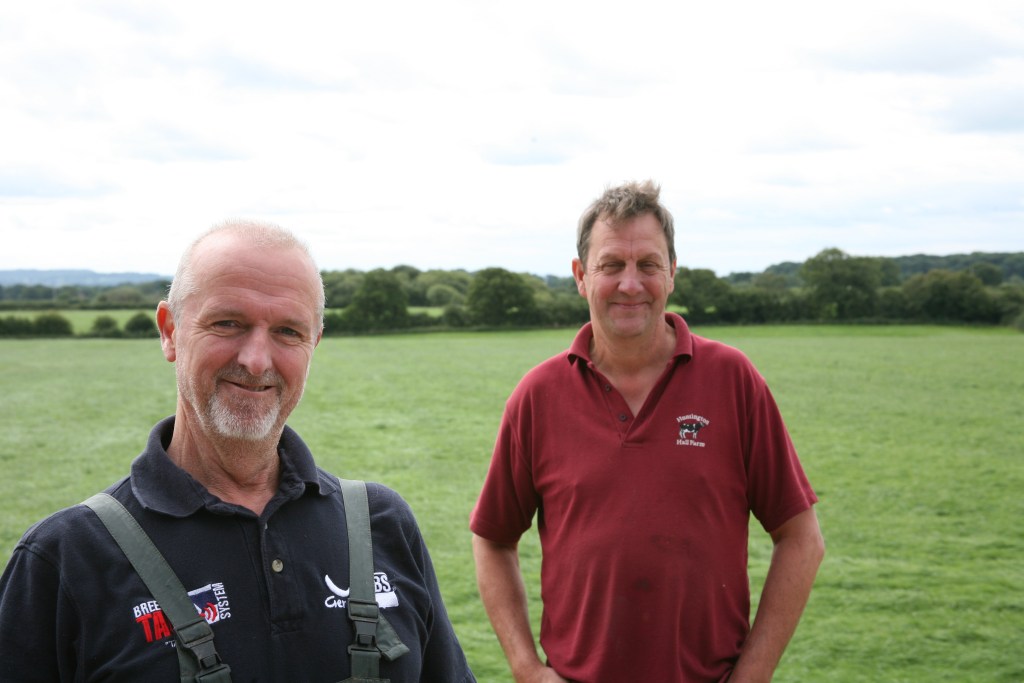
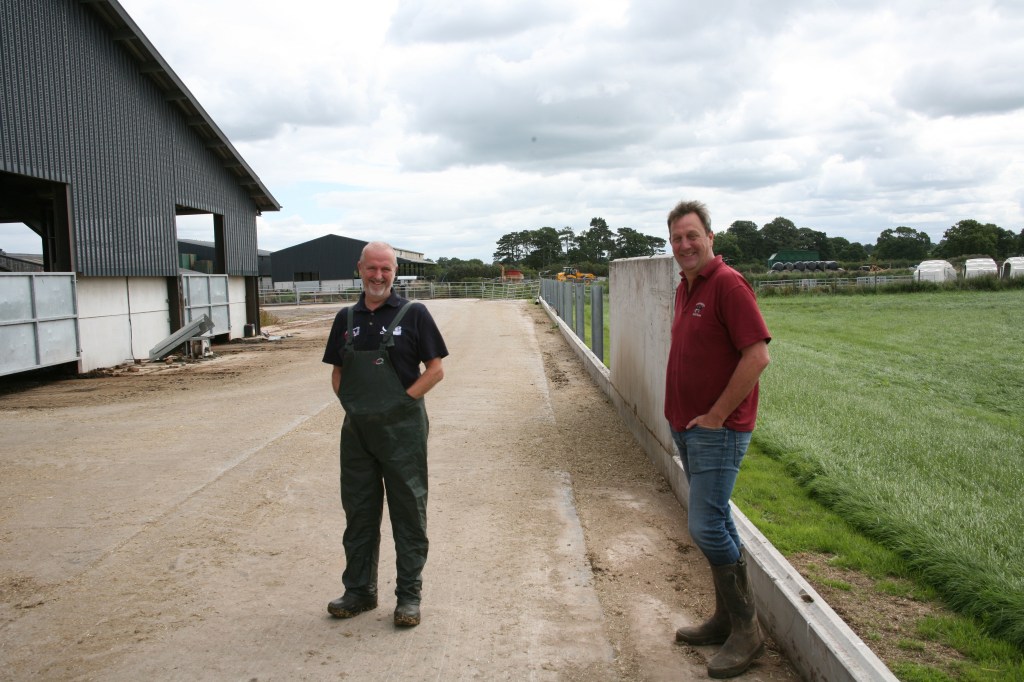
Despite farming 250 miles apart, John Allwood from Huntingdon near Chester and Jack Elliott from Torrington in Devon have several things in common. They are both running large, high yielding all round calving dairy herds. And they are both convinced of the importance of using data to guide their thinking on how to improve performance.
They are both making full use of Feed Face, a new optional module available with the Genus ABS Breeder Tag System. It provides comprehensive data on cow behaviour, particularly related to the number and duration of feeding visits, which Patrick Spencer, Genus ABS UK Manager Health, Fertility, Technology, says can be used to identify improvement opportunities to drive efficiency
“How a cow spends her time has a massive influence on performance, both production and fertility,” he explains. “In an ideal set -up a cow will spend 50% of her time lying down, 19% in fixed management activities such as milking and 21% eating. Optimising feed intakes is driven by a combination of visits per day to the feed trough and the length of these visits.
“A wide range of factors affect the time spent eating including timing of feeds, the number of feeds and frequency of pushing up, feed presentation and diet consistency, feed quality, cow grouping, feed fence space, time on concrete, disease, feed fence design and heat stress to name a few.
“Anything that reduces feeding time will impact on milk production and can impact on fertility so the data collected by Feed Face can highlight potential problems and allow management changes to improve feeding time and unlock potential management improvements. At the same time by spotting changes in routine it can highlight management events like heats and also signs of disease.”
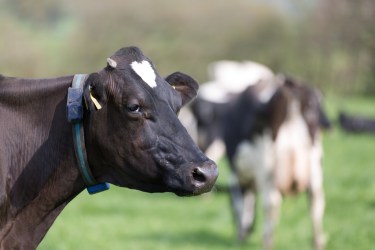
Mr Spencer says that front leg fitted pedometers are the most accurate way to collect data on activity and movement, saying that collars and ear tags are less effective at identifying when cows are standing or lying down, as these are deemed as periods of low activity which can be clearly determined with pedometers.
“If we want to track activity and use it as a pre-curser to an oestrus event, then the leg is going to give us the best information with live time pure data which will lead to less false positives and improved accuracy. Using the same principle, we can look for changes in behaviour with activity, lying, standing and swapping from one to the other which will give us very early warnings of health events.
“If you can then combine that data with the Feed Face technology we can track visits and duration to the nearest minute, looking for exceptions. It will highlight potential problems in the dry cow period that won’t show as clinical signs until she gone through her most stressful period, allowing us to be proactive rather than reactive to an event.”
Eighteen months ago, with John Allwood about to add five bays to the building housing his high yielders and transition cows Patrick Spencer arranged for the two farmers to meet and compare notes. Jack’s herd was performing better, and John was keen to see how the data could help unlock greater potential from his cows.
“Jack was achieving more time eating from both milking and dry cows, despite fewer visits per cow (table 1). In addition, his lying times were higher. John was keen to understand the reasons for this as he looked to commission the new cow accommodation.”
“When looking at the data and discussing the possible reasons, one of the factors affecting the herds was feed space per cow,” Patrick Spencer comments. “Looking at the access to feed, John’s milking and dry groups have 15cm less feed face access per cow, whereas Jack’s was primarily because his buildings had two rows of cubicles while John’s building in Cheshire was a three row configuration which immediately puts pressure on trough access.
“This difference in feed access explained the different behaviour seen and prompted a healthy debate. John’s cows, both milking and dry, were making more visits but each visit was significantly shorter leading to reduced feeding time per day, possibly due in part to increased competition at the feed fence. However, the lying times are pretty consistent, and cows were averaging 38 litres per day.”
The question is would milk output from the building be constant if stocking rate was reduced and the remaining cows milked better as a result of improved eating times? At the same time would cows transition better if feed access was improved?
For the high yield milking cows in the expanded building, John Allwood initially calculated that to increase the feed trough access to the target of 26 inches from the current 19 inches would mean adding no more cows and require a significant increase in yield per cow on the current average of 50 litres/day from the 180 in cows in the building.
“Increased space would mean fewer cows and this made it questionable whether we would see a return on our investment because the milk produced from the building was unlikely to be maximised compared to what we could produce by stocking the building based on the available cubicles which would allow us to house 240 cows,” John comments.
But the key metric is feed duration and how long cow spend eating, rather than physical trough space and this can be affected by many other factors. Feed duration is important as research shows that each additional minute of feeding time increases milk yield by 0.03kg (C Johnson and T J DeVries).
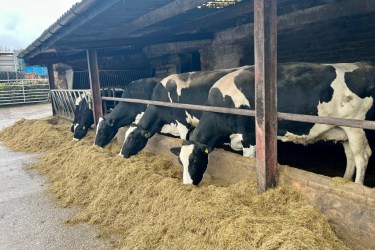
John did experiment with reduced stocking rate, but the data showed no marked increase in either visit number or duration. The cows were still fed a TMR with 57% forage twice a day with feed pushed up regularly.
Over the next 15 months the Feed Face data was used to help monitor behaviour in the new building, highlighting the benefit of other management changes (table 2).
In July 2018 John increased the milking cow group to 222 cows in 250 cubicles, anticipating an increase in feed duration. However, when the data was analysed there was no change in feed duration, feed visits or lying time which was not the anticipated results.
John noticed that the cows were congregating in the new bays and not eating evenly across the entire feed face. In addition, cows were standing and queueing to lie down in the cubicles at this end of the building which were deep sand bedded. This really brought home a cow’s inherent behaviour to rest, even at the loss of feeding time
“The cows had been bedded on mattresses but we decided to use deep sand in the new bays and noticed cows were much keener on the new beds and were prepared to stand and wait, which was reducing feed duration,” John comments.
So, the decision was taken to put sand instead of sawdust on the remaining mattresses. As a result, feed duration was increased by 35 minutes per cow from the same number of visits and lying time increased marginally.
By August of 2019 all the mattresses were removed, and all cubicles are now deep sand bedded, resulting in a further increase in feed duration to over four hours a cow as the full length of the feed face was being used more evenly
When the data on feeding times were reviewed again, the milking cows had dropped back again to 3.28 hours in the summer, before getting back to close to four hours again in the winter. This summer saw another decline.
Despite the building having fans, John suspects this is due to heat stress and he has invested in upgrading the water supply and adding extra troughs to stop cows having to wait at the troughs.
“It’s about attention to detail and small changes,” he continues. “Cows are generating a lot of heat so it is understandable that they will; be less interested in eating on hot days. If we can help them drink faster, hopefully we would see an increase in eating times again. The latest numbers for August this year suggest that improving water supply has helped maintain feed duration at close to four hours a day.”
Bigger differences were seen with the transition cows where John has set up the building to ensure more space. With just two rows of cubicles, feed face space is 30 inches per cow.
“With fertility improving in part due to the use of Breeder tag System we were often tight for transition cow space but now we can always accommodate them comfortably. We have also moved to sand cubicles in this group as well.”
The Feedface data show significant improvements in behaviour. The lying time in the transition group has increased from 50-54%. Feeding time has increased from 2.24 hours/day to 3.37 hours with one less visit /day. Cows are eating more when they visit and then going back and lying down.
Patrick Spencer says the benefits of improved transition management can be seen in fresh calved performance. “The four-week milk yield has increased from 43 litres to 53 litres/day, which is a really good indicator to transition health. Conception rate has also improved to an average of 37%. The heifers are also showing benefits. Despite calving in at 22.7 months, then are average 2.6 litres/day more than last year.
“John has managed to increase fertility, reduce the incidence of disease and produce higher yields. We have all the data we need to fine-tune management, but it is a continuing story as we identify new improvement opportunities. A combination of improving the environment, increasing the lying times and getting cows to feed for longer has allowed us to make the most of our genetic improvement. In 2018 the herd was averaging 11,400 litres but this is now 12,300 litres, indicating the benefits of increasing feed duration.
“We will be looking at further reducing heat stress in the transition group and identifying the causes of changes in feed duration between winter and summer. Having all the data has allowed us to track all the changes made and see the improvements, or not, and continue to refine management to improve productivity and control feed costs.”
Table 1
| Intake duration (hours/day) | Intake visits (visits/day) | Lying time (% of day) | ||||
| Allwood | Elliott | Allwood | Elliott | Allwood | Elliott | |
| Milking | 3.26 | 4.30 | 10 | 8.9 | 49 | 54 |
| Dry | 2.40 | 5.00 | 11 | 10 | 50 | 54 |
Table 2 Milking cow performance
| Date | Cow number | Lying time (%) | Feeding duration (hours/minutes) | Feeding visits |
| April 2018 | 224 | 44 | 3.12 | 10 |
| July 2018 | 222 | 43 | 3 12 | 10 |
| Nov 2018 | 223 | 45 | 4.01 | 10 |
| Aug 2019 | 228 | 46 | 3 28 | 10 |
| Nov 2019 | 228 | 46 | 3.57 | 10 |
| March 2020 | 225 | 47 | 3.50 | 10 |
| August 2020 | 223 | 45 | 3.57 | 10 |